Colorado Seniors and Their Health: Where Are Older Adults Most Vulnerable?

Colorado is getting older. By 2050, there will be twice as many seniors as there are today, a demographic sea change that will impact Colorado’s economy, its infrastructure, the age and skills of its workforce, and the social landscape.
March 10, 2023

The health of this new wave of 65-and-older residents will be a major consideration for policymakers — and, of course, for the older adults and their families and friends. It will require extensive planning, particularly to ensure that adequate long-term services and supports are in place to help seniors age in their homes and their communities. 

Report
Download Full Report 

The Colorado Health Institute (CHI), in an effort to better understand the state’s aging population in preparation for the coming changes, has created an index that pinpoints counties with the highest proportion of vulnerable seniors. It is based on two factors — risks such as poverty, age or living alone, and needs such as physical or cognitive difficulties. A score of 10 indicates areas with the most vulnerable seniors. A score of one means an area has the least vulnerable seniors.

CHI’s aging vulnerability index shows that older Coloradans in some parts of the state are more vulnerable — and will most likely need more health care and supportive services — than others.

The new findings include:

  • Colorado’s overall aging vulnerability score is 4.9.
  • Counties on the Eastern Plains and in the San Luis Valley have the highest concentrations of vulnerable seniors.
  • Otero County scores 9.2 on the overall vulnerability scale — the highest in the state. Baca, Costilla and Crowley counties are second, each at 9.1.
  • Mountain counties, including Park, Summit, Ouray, and Clear Creek, are the least vulnerable, with seniors reporting lower levels of both risk and need.
  • Park County has the lowest vulnerability score in the state at 1.6.
  • Front Range counties have overall lower levels of vulnerability than rural ones, but are home to larger numbers of seniors.

Creating the CHI Aging Vulnerability Index

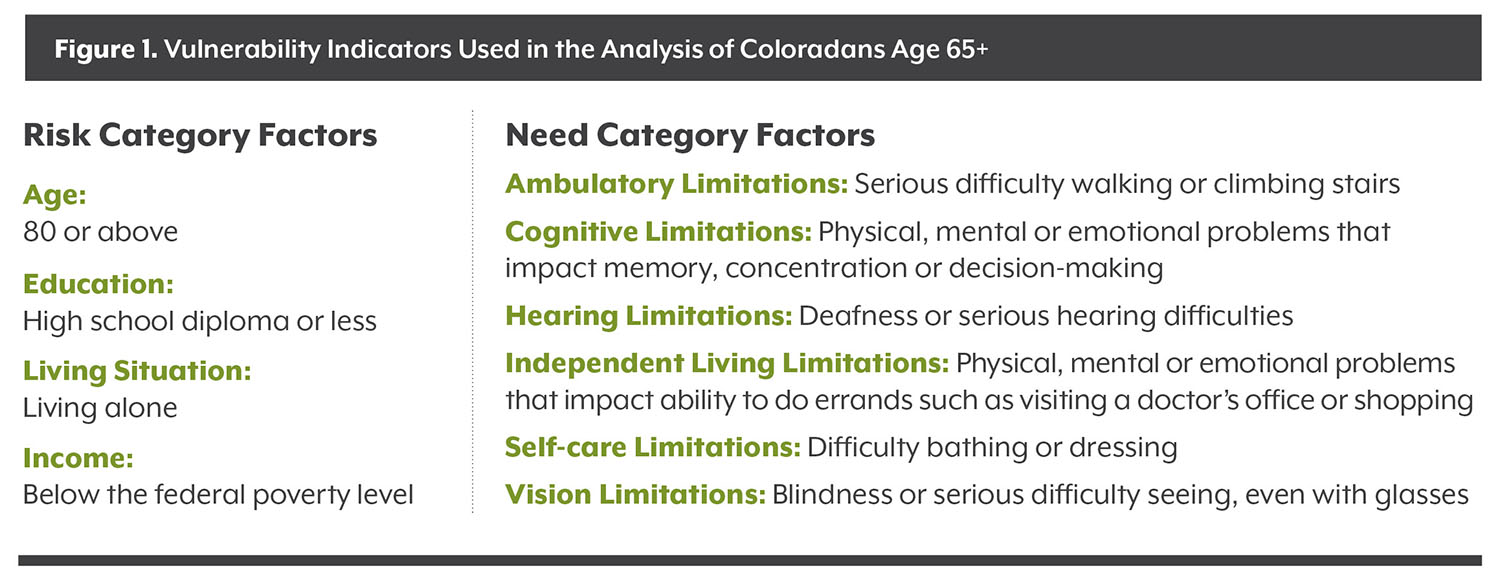
CHI selected 10 factors related to aging vulnerability for this analysis based on a review of scientific literature and the recent availability of county-level data.

The data, compiled from the U.S. Census Bureau’s American Community Survey and the Colorado State Demography Office, are divided into two categories:

  • Risk Factors: Four demographic measures that often mean a senior will be more at risk, including being over 80, having a high school diploma or less, living alone, and being below the poverty level.
  • Need Factors: Six physical or behavioral measures that indicate seniors are already experiencing limitations that lead to vulnerability.

Colorado’s 64 counties were scored on each of the 10 measures and placed into deciles. For instance, counties in the top 10 percent of an indicator received a score of 10, the highest vulnerability level. Counties in the bottom 10 percent of the indicator received a score of one, the lowest vulnerability level.

These scores were then summed and divided by 10 to reach an average score for each county.

Equal weight was given to each of the 10 measures.

The highest possible score is 10.0 and the lowest is 1.0. The Colorado state average is 4.9. Urban counties in Colorado tend to be less vulnerable. Because these counties account for a disproportionate share of the state population, the state score is below the median of 5.5.


Why Are Aging Vulnerability Indicators Important?

CHI’s Aging Vulnerability Index is intended to be a resource for community-based organizations, foundations, local and state agencies and Colorado policymakers as they strategically allocate resources to ensure that all the state’s older adults are well-supported as they age.

Understanding Colorado’s older population can help communities support seniors as they age by ensuring adequate social programs, health care, transportation, workforce levels and resources. About 90 percent of older adults hope to spend their golden years in their homes or communities rather than in an institutional setting, according to AARP.¹

Figure 1


Colorado Seniors: Location Matters

Southeast Colorado and San Luis Valley are home to the highest concentrations of vulnerable seniors, according to the Aging Vulnerability Index. (See Map Below)

Otero County scores 9.2 on the overall vulnerability scale — the highest in the state. The county’s seniors report having vision and cognition limitations at rates above the state average. Forty percent of Otero seniors live alone.

Baca and Crowley counties, also in southeast Colorado, follow closely at 9.1 each. Costilla County scored 9.1 and Conejos County scored 9.0. Both are in the San Luis Valley.

These five high-vulnerability counties have some of the state’s highest percentages of seniors who report difficulties walking or climbing stairs, having cognitive limitations and facing barriers to living independently.

Some urban counties also have higher-than-average scores. Pueblo County, for instance, is at 7.7, and Denver is at 7.0. Nearly half of Denver seniors live alone, and both counties have above-average rates of seniors with physical or mental challenges that hinder their ability to live independently.

Seniors in mountain resort counties along the Interstate 70 corridor have some of the lowest vulnerability scores in Colorado. Park County, with the lowest vulnerability score in the state at 1.6. Other standouts include Summit County at 1.7 and Eagle County at 1.9.

Some urban and Front Range counties also have low scores, indicating low levels of vulnerability including Clear Creek at 1.9 and Douglas County at 2.1.

Text Continues Below

Interactive Index Dashboard

A Changing Population

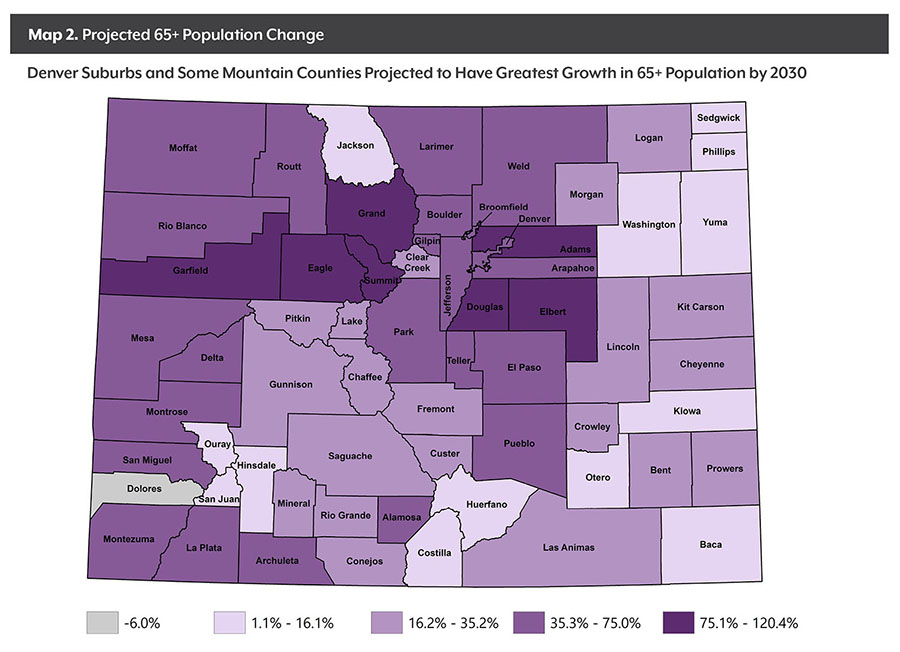
Colorado’s 65-plus population is predicted to grow by 61 percent between 2016 and 2030, with some regions more than doubling the number of seniors, according to the Colorado Demography Office. Colorado has historically had a younger-than-average population, but the state’s proportion of its 65 or older residents grew faster than in all but two other states between 2010 and 2015.

The rate of projected growth in the number of seniors varies across Colorado.

Eagle County’s 65+ population will more than double to 12,300 in 2030 from 5,600 in 2017. The rural counties of Elbert, Garfield and Grand will experience increases of more than 90 percent, as will urban Douglas County.

Several rural counties, however, will see little to no growth, including Baca, Ouray and San Juan counties. And the 65+ population in Dolores County in southwest Colorado will shrink by six percent. (See Map 2 Below.)

While many mountain and Front Range counties have low Aging Vulnerability Index scores today, that could change as their populations of seniors over the age of 80 increase.

And policymakers will be paying attention to counties with the most seniors, regardless of their score.

The top five counties with the largest 65+ populations in 2017 are Jefferson (94,200), El Paso (88,000), Arapahoe (85,000), Denver (82,000), Adams (53,400) and Larimer (51,800).


Drivers of Vulnerability: Risk Factors

When solely considering the four risk-based measures — the demographic factors that often spell vulnerability for seniors — Colorado’s overall score is 4.5. However, risk scores vary considerably by county. (See Risk Map Above.)

Rural counties, especially those on the Eastern Plains, had the highest risk scores. Kiowa and Washington counties each had 9.3 scores, the state’s highest.

In Washington County, 46 percent of seniors live alone, 10 percent are in poverty, 31 percent are 80 or older, and 60 percent have a high school diploma or less. In Kiowa County, 53 percent of seniors live alone, 10 percent are in poverty, 31 percent are 80 or older and 65 percent have a high school diploma or less.

Douglas and Elbert counties had risk scores of 2.0 and 2.3, some of the lowest scores among Front Range counties.

Summit, Ouray and Mineral counties had the lowest risk scores in the state of 1.5.

Drivers of Vulnerability: Need Factors

When it comes to the six need factors — the measures that show the seniors who are already experiencing physical or mental limitations — Colorado’s average score is 5.1.

As with risk, the highest concentration of seniors with needs is found in Colorado’s rural areas, including the Eastern Plains and the San Luis Valley. (See Need Map Above.)

Crowley and Costilla counties each scored a 10.0 for need, the state’s highest. Forty percent of Crowley County’s seniors have difficulty walking or climbing stairs, 28 percent have cognitive difficulties, and 32 percent face physical or mental challenges to living independently.

In Costilla County, 40 percent have difficulty walking or climbing stairs, 35 percent have hearing difficulties and 28 percent have challenges to living independently.

Front Range and Ski Country counties have the lowest need scores. In Park County, with Colorado’s lowest need score of 1.2, just 11 percent of seniors report difficulties walking or climbing stairs, two percent have cognitive difficulties, 10 percent have hearing limitations and one percent have self-care limitations.

A Nuanced Picture: Where Risk and Need Don’t Align

CHI’s analysis found some surprising contradictions, evidence that each county and community is home to seniors with unique risks and needs.

These scores can help providers and policymakers develop plans to address the unique challenges in their counties.

Some of the nuanced findings:

  • Sedgwick and Rio Blanco counties score relatively high on risk, with many older adults having a high school diploma at most or less or living alone. But relatively few residents in these counties struggle with ambulatory, cognitive or independent living limitations.
  • Tiny Mineral and San Juan counties have lower risk scores, with fewer seniors living in poverty and relatively low rates of adults over age 80. Yet these residents are more likely to struggle with independent living or hearing limitations.
  • Seniors in Cheyenne County have some of the highest levels of hearing limitations and difficulties walking or climbing stairs. But they also report some of the lowest rates of self-care or independent living limitations.
  • Boulder County has a relatively high rate of older adults living alone, but its seniors report few other demographic risk factors and modest physical limitations, resulting in a score of 3.8.

Overall, seniors in counties in the mountain region tend to have higher levels of risk but fewer needs: Seniors are more likely to live alone and to be above 80, but they don’t report as many need factors. Older adults in these communities may benefit from programs that help seniors keep up with chores and home repairs, or a volunteer network for snow removal.

Counties along the state’s southwest corner have lower risk scores but higher need scores. Seniors here face higher rates of hearing and mobility limitations, even though the counties have relatively few older adults living in poverty.

Seniors in higher-population counties along the Front Range tend to have relatively higher incomes and educational attainment. These communities may have high demand for specialized transportation or in-home caregiving.

Conclusion

As Colorado’s population ages, ensuring that seniors have access to health care, supports and safe environments will be an increasingly significant health policy undertaking for the state.

This analysis shows that what seniors will need will vary by county. A one-size-fits-all strategy for supporting Colorado’s older adults will not be effective and it won’t be an efficient use of resources.

The Aging Vulnerability Index is intended to help advocates, policymakers and others assess the characteristics of their senior residents as they determine the best policies, programs, and plans to meet their seniors’ needs. A deeper dive into the indicators will help stakeholders who are working to meet the needs of their changing populations.