2017-18 EBNE: Momentum Reverses
Key Takeaways
- The number of Coloradans who were eligible for but not enrolled in Medicaid, Child Health Plan Plus (CHP+), or advance premium tax credits (APTC) has increased for the first time since 2015.
- The number of eligible children who were not enrolled in Medicaid increased to the highest level in four years.
- Children with parents who are noncitizens make up over one-third of the eligible but not enrolled population.
Colorado’s decline in enrollment is over three times that of the national average. These changes in enrollment may be the result of fear in immigrant communities over a federal crackdown on immigration, an improved economy over that period, and administrative and system changes in Medicaid.
These decreases in Medicaid and CHP+ may explain other notable changes in Coloradans’ coverage. Out of the nearly 420,000 Coloradans who were uninsured in 2018, just over 239,000 were eligible for but not enrolled (EBNE) in Colorado’s Medicaid program, CHP+, or advance premium tax credits (APTC). These three programs are designed to help low- and middle-income Coloradans access public and private health insurance coverage.
In 2018, the EBNE population increased for the first time in four years. This increase was driven primarily by two factors. First, more people became eligible for APTCs to purchase insurance on Colorado’s health insurance marketplace, Connect for Health Colorado. Second, the number of eligible children not enrolled in Medicaid spiked to its highest level since 2015.
Download the data tables (Excel format)
It is worth noting that Medicaid’s EBNE adult population decreased for this period.
In this report, CHI addresses each of the potential drivers for the decrease in enrollment and impacts on the EBNE population.
To understand the impact of federal proposals around immigration, CHI performed a new analysis to estimate the eligible but not enrolled rate for children who have a noncitizen parent. Nearly 35 percent of the EBNE child population for Medicaid and CHP+ were children with a noncitizen parent. This equates to nearly 11,900 Coloradan children.
This brief updates CHI’s ongoing Medicaid, CHP+, and APTC enrollment analysis and further explores Coloradans who are EBNE by age.
Following the Trends
Changes to EBNE from 2015 to 2018
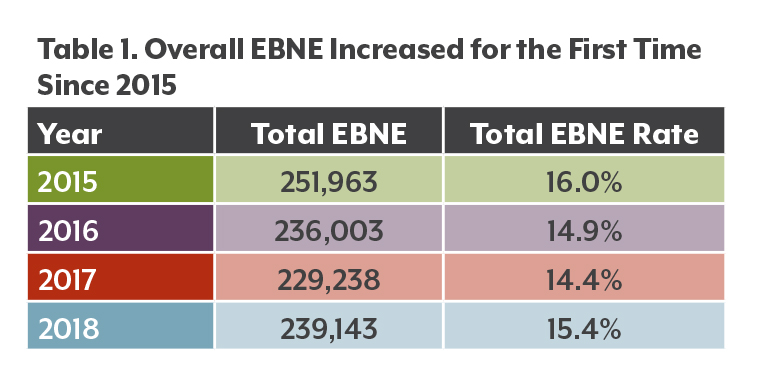
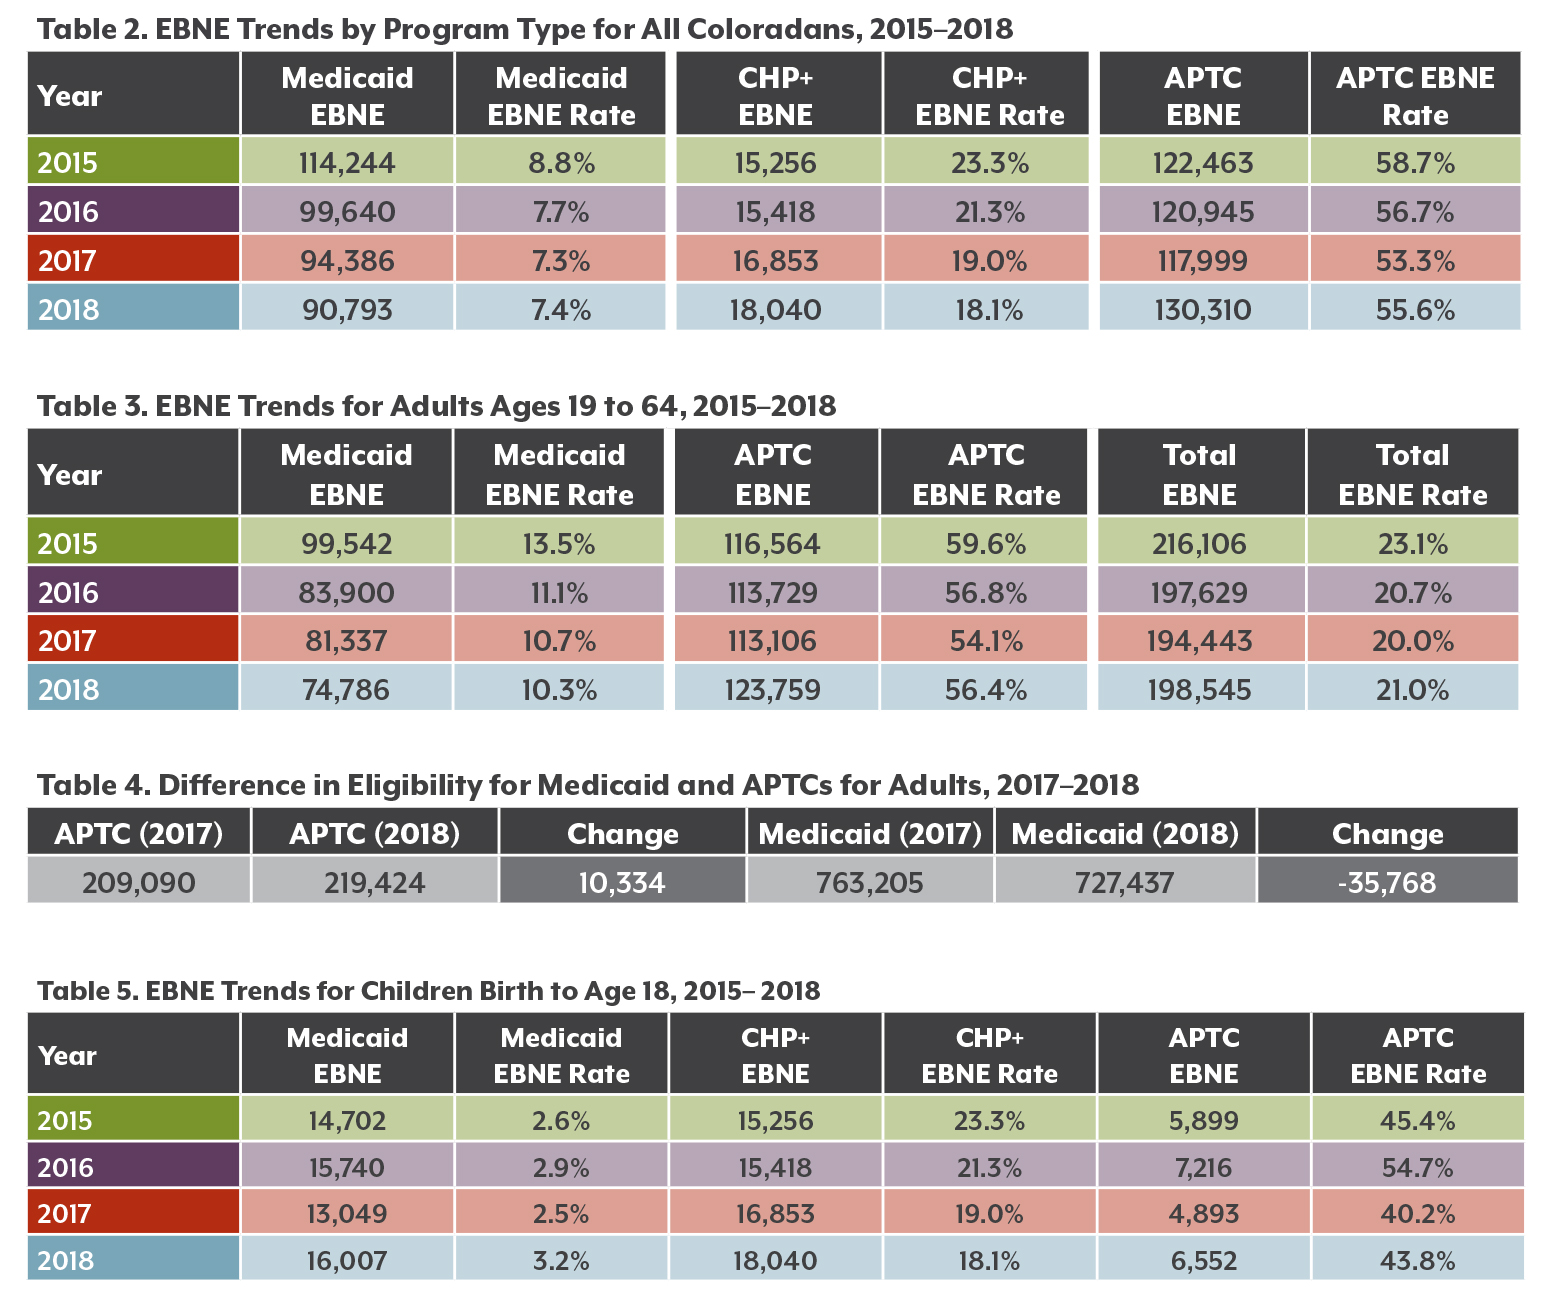
In 2018, about 239,000 Coloradans were eligible for but not enrolled in Medicaid, CHP+, or APTCs. This was the first increase since 2015. Colorado has had steady declines in the overall EBNE rate between 2015 and 2017 (see Table 1).
Medicaid has seen especially pronounced declines in its EBNE numbers since 2015 (see Table 2).
The number of CHP+ EBNE children increased over the past four years, although the rate decreased from 23.3 percent in 2015 to 18.1 percent in 2018. While there were slightly more CHP+ EBNE children, CHP+ enrollment also increased, which drove down the EBNE rate for this program.
The number of Coloradans who were APTC-eligible but not enrolled steadily decreased from 2015 to 2017. However, there was an increase from about 118,000 in 2017 to just over 130,000 people in 2018. Although the EBNE rate for APTCs appears higher than EBNE rates for other programs, this is not a surprising trend. APTCs provide financial assistance to purchase private health insurance, yet these insurance premiums may still be too expensive even with the credit, leading eligible individuals to opt out all together. Between 2017 and 2018, the average premium cost for individual plans increased by 26.7 percent, while small group medical plans saw a 6.6 percent price increase.2
2018 marked a pivot in enrollment among Coloradans eligible for public programs, specifically CHP+ and APTC, with an overall increase in the number who were eligible but did not access them.
Trends for Colorado Adults
Among Colorado’s adults, the EBNE rate for Medicaid fell between 2017 and 2018, but rose among those eligible for APTCs (see Table 4).
Economic trends may explain this inverse relationship between Medicaid and APTC EBNE rates. As adults start to get better paying jobs and move up into higher income brackets, they are no longer eligible for Medicaid. They will, however, become eligible for APTCs. Table 4 shows that about 10,000 more adults became eligible for tax credits in 2018, while nearly 36,000 fewer adults qualified for Medicaid.
Interestingly, around half of unenrolled adults for APTCs or Medicaid were under age 34 in 2018. This aligns with this group’s higher-than-average uninsured rates: Nearly 9.7 percent were uninsured in 2019 compared to the state average of 6.5 percent.4
Even with the help of tax credits, many adults ages 19 to 34 may not be able to afford health insurance. According to data from the 2019 Colorado Health Access Survey, 95.4 percent of uninsured adults in this age group said they couldn’t afford to purchase coverage.
What Is EBNE?
Eligible but not enrolled estimates reflect the number of Coloradans who meet eligibility criteria for Medicaid, CHP+, or APTC but are not enrolled or accessing the program or credit. CHI developed the eligible but not enrolled estimates using these sources:
• The Colorado Department of Health Care Policy and Financing (HCPF) provided enrollment data for Medicaid and CHP+.
• Connect for Health Colorado provided enrollment data for APTCs.
• The U.S. Census Bureau’s 2018 American Community Survey (ACS) provided estimates of uninsured populations.
CHI developed a method for estimating the likelihood that someone was an immigrant who lacked legal documentation, since there is not an official count of that population in Colorado. This method was based on findings from a 2006 Pew Hispanic Center report (See the supplemental “Methods and Limitations” document for more).
Interpretation of EBNE Rates and Estimates
EBNE rates are the number of people who were eligible but not enrolled divided by the number of people who were eligible for that program. CHI estimates eligibility by adding the number of people who are EBNE and the number of people who were enrolled. EBNE rates can change from year to year because of changes in either factor — the number of people enrolled and the number of people eligible but not enrolled.
Trends for Colorado Children
The EBNE population among Colorado children grew from about 35,000 in 2017 to about 40,600 in 2018.
The increase was driven by children who were not enrolled in Medicaid. More than 16,000 Colorado kids qualified for Medicaid but were not enrolled. The majority (56.3 percent) of them were Hispanic/Latinx.
Even more children were eligible but not enrolled in CHP+ — just over 18,000 or 18.1 percent (Table 5). Hispanic/Latinx children made up 46.9 percent of the CHP+ EBNE group. There was also a slight increase in the number of EBNE children for APTCs. However, this population is relatively small and fluctuates from year to year.
Immigration politics could explain the increase in the Medicaid EBNE rate for children. The Trump administration has taken a number of actions — including separating families at the border, workplace raids, and policy changes — that have likely created a “chilling effect” that makes families of immigrants reluctant to interact with government programs, even if their U.S. citizen children are eligible.
One such policy change is the public charge rule, which makes it harder to immigrate legally to the United States for people who cannot demonstrate their ability to financially support themselves without becoming a “public charge” of the state.5 Rhetoric around changing the public charge rule began in September of 2018, and an updated policy eventually took effect in February 2020. CHI estimated that it would lead to the loss of coverage for 75,000 Coloradans who use Medicaid and CHP+.6 Nearly three-quarters of those who were estimated to be likely to lose their coverage were U.S. citizens, and nearly two-thirds of them children. Uninsured rates were expected to increase across populations, while the overall child uninsured rate was projected to rise the most, from 3.0 percent at the time of the 2018 analysis to a projected 6.7 percent.
For this EBNE analysis, CHI investigated how immigration politics might affect enrollment rates.
CHI estimates that nearly 35 percent of EBNE children had at least one parent who was a noncitizen in 2018 — this translates to 11,900 children in Colorado. By comparison, just 23.7 percent of children enrolled in Medicaid had at least one noncitizen parent, which suggests that immigration dynamics play a substantial role in the EBNE rate for children in Medicaid.
Administrative Changes and Analyses
Internal policies at the Department of Health Care Policy and Financing (HCPF) also might have influenced the Medicaid EBNE rate. HCPF, which runs the state Medicaid program, changed its rules in April 2018 to disenroll Medicaid members who have one piece of returned mail that the department sends to their address, rather than three.7 HCPF made the change to make sure Colorado isn’t covering Medicaid members who have moved out of state and to reduce administrative costs and burden.
HCPF itself has delved into factors related to declining enrollment. In a recent analysis of public charge and churn — a term used to describe fluctuations in a person’s coverage — the Department found that young adults and adults newly eligible under ACA provisions were most likely to have a break in enrollment in 2018 and 2019. Children likely to be impacted by public charge, however, had higher disenrollment rates than adults. HCFP advised caution in interpreting the findings, as the analysis did not establish direct causal connections between these factors and declining enrollment.8
Who Are the Other Uninsured Coloradans?
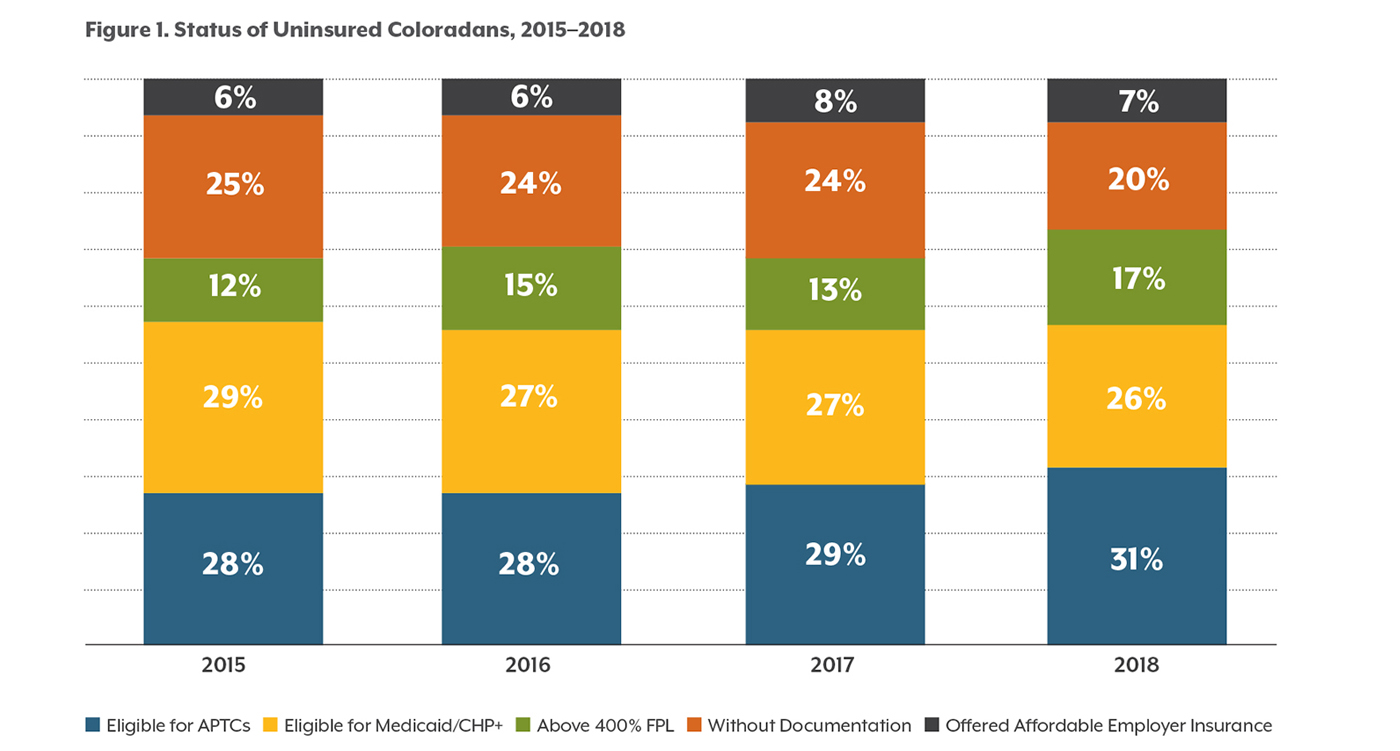
The EBNE population is only a portion of the total uninsured population. As seen in Figure 1, the rest of Colorado’s uninsured people are in three main categories:
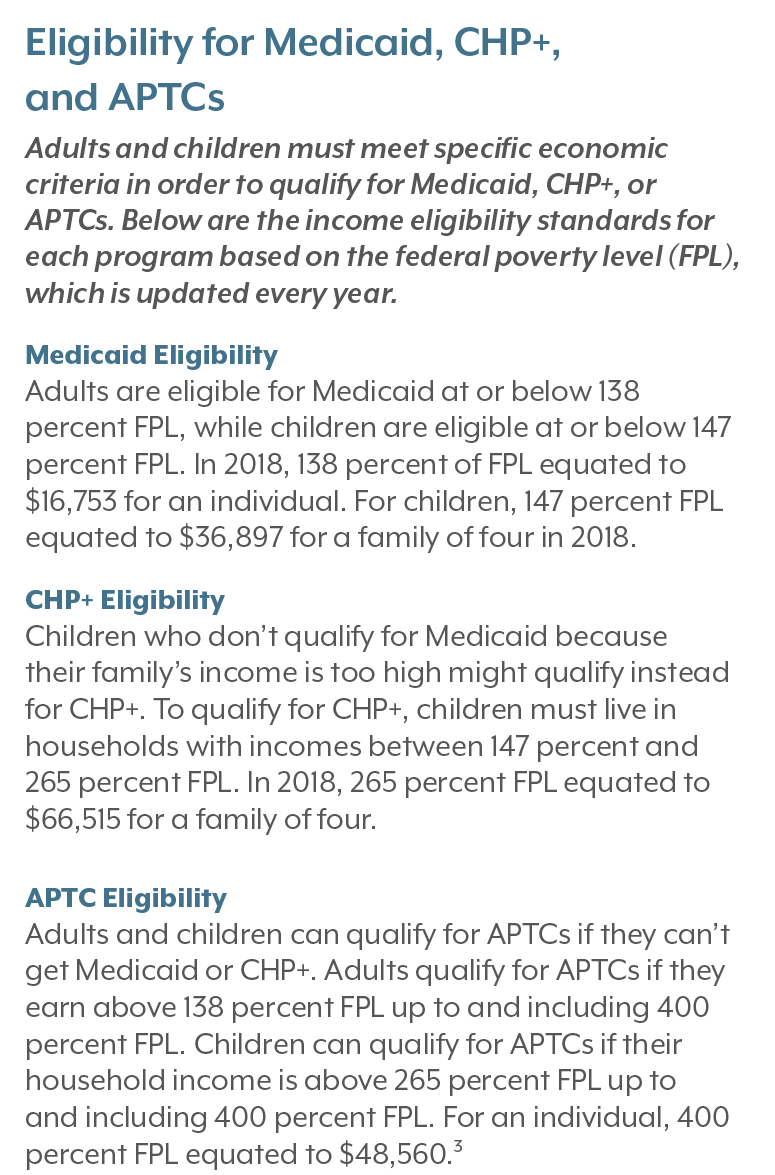
• More than 69,000 uninsured Coloradans were not eligible for any type of coverage assistance because they earned more than four times the poverty level, or $48,560 for a single person in 2018. This group made up 17 percent of the uninsured population in 2018.
• Another 27,500 uninsured Coloradans weren’t eligible for assistance because they were offered affordable coverage by an employer, making up another 7 percent of the uninsured population.
• And an estimated 84,000 uninsured Coloradans did not qualify for coverage assistance because of their immigration status. These individuals accounted for 20 percent of the uninsured population in 2018.
Conclusion
Knowing who makes up the EBNE population in Colorado allows policymakers, safety net providers, program administrators, outreach and enrollment workers, and other stakeholders to understand how to target enrollment programs in two primary ways.
First, it is important to understand which Coloradans may become uninsured once losing Medicaid eligibility and becoming eligible for APTCs. This will inform discussions around policy attempts to address insurance affordability concerns — such as funding reinsurance and the proposed Colorado Affordable Health Care Option (formerly referred to as the “public option”).
Second, it is important to track future changes in the number of children who are eligible but not enrolled who come from mixed-citizenship status households. This can reveal how federal policy changes — either proposed or adopted — affect Medicaid and CHP+ enrollment and uninsured rates for children.
To help decrease the number of uninsured Coloradans, legislators have introduced House Bill 1236, known as the Health Care Coverage Easy Enrollment Program.
This bill, if passed, would use the tax filing process to help people check their eligibility for insurance assistance programs. Coloradans would be able to indicate on their income tax returns if they wanted to check eligibility for Medicaid, CHP+, and APTCs for uninsured family members in their household. This new bill could be one way to help decrease the number of Coloradans who are currently eligible but not enrolled in insurance assistance programs.
Although this report follows past analysis, trends are expected to change in coming years due to COVID-19 and its impact on Colorado’s economy. Because of this, it will be more important than ever to understand Colorado’s eligible but not enrolled population, as many Coloradans may enter this pool due to unemployment in 2020.
But Wait … How Many Uninsured Coloradans Are There?
Data from the 2019 Colorado Health Access Survey (CHAS) indicate that about 361,000 Coloradans are uninsured. The 2018 ACS, used in this analysis, reports about 420,000 uninsured Coloradans.
What accounts for this gap?
The data are from different years, and the surveys use different methodologies. For example, the ACS has a larger sample size, but the CHAS includes more confirmation questions to accurately determine respondents’ insurance status. The ACS is used in this analysis because its larger sample allows for county-level estimates
and its detailed demographic profiles allow for the most accurate estimates of the eligible population.
Endnotes
1 Colorado Center on Law & Policy. (2019). “What’s Causing Colorado’s Decline in Medicaid & CHIP Enrollment?”. Issue Brief. Retrieved from https://cclponline.org/wp-content/uploads/2019/11/CCLPMedicaidDrop_11.05.2019_2.pdf.
2 Colorado Division of Insurance. (2017). “Division of Insurance approves health insurance premiums for 2018.” Retrieved from https://www.colorado.gov/pacific/dora/news/division-insurance-approves-health-insurance-premiums-2018.
3 U.S. Department of Health and Human Services. (2018). “2018 Poverty Guidelines.” Retrieved from https://aspe.hhs.gov/2018-poverty-guidelines.
4 Colorado Health Institute. (2019). Colorado Health Access Survey.
5 Colorado Health Institute. (2018). “Changing the ‘Public Charge’ and Health Insurance in Colorado.” Retrieved from https://www.coloradohealthinstitute.org/research/changing-public-charge-and-health-insurance-colorado.
6 Colorado Health Institute. (2018). “Changing the ‘Public Charge’ and Health Insurance in Colorado.” Retrieved from https://www.coloradohealthinstitute.org/research/changing-public-charge-and-health-insurance-colorado.
7 Colorado Department of Health Care Policy and Financing (2018). Agency Letter 18-007. Retrieved from https://www.colorado.gov/pacific/sites/default/files/Agency%20Letter%20Returned%20Mail%203-2018%20updated%20final.pdf.
8 Martin, B. (2020). “Churn Analysis Overview.” Colorado Department of Health Care Policy and Financing. Presentation on Feb. 24, 2020.

